“Vendor inspection is expensive – can’t we just reduce it?”
If you have ever tried to defend travel budgets, TPI fees or training costs, you know this sentence very well. Without numbers, vendor inspection is seen as a cost centre. With numbers, it becomes insurance with a measurable return.
This guide shows you how to:
It is written for:
You can treat this article as the “numbers add-on” to conceptual pieces like “What Is Vendor Inspection? Roles & Responsibilities” and the persuasion-focused “Convince Your Manager: Fund Vendor Inspection Training”.
In many organisations, vendor inspection is handled like this:
The problem is simple: nobody shows the ROI.
Without a basic ROI model:
An ROI view allows you to say things like:
That is a very different conversation than “we think inspection is important”.
Vendor performance data from tools like “SQS KPIs That Matter (Vendor Scorecards)” gives exactly the kind of input that turns this from opinion into a data-supported story.
The classic Cost of Quality (COQ) model splits costs into four buckets:
Vendor inspection lives mostly in the Appraisal bucket, with some overlap into Prevention (for example, when inspectors give early feedback that improves future batches).
The goal is not to minimise inspection cost to zero. The goal is to find a balance where:
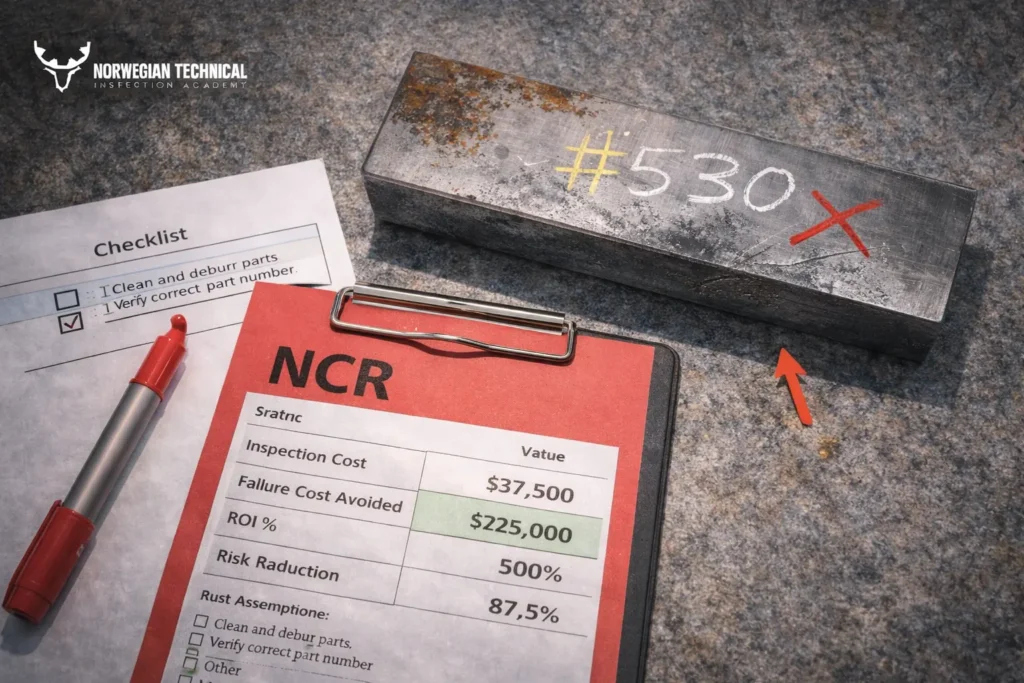
Take a simple example:
The cost of these prevented failures might be 10–20 times the incremental inspection cost.
Typical vendor NCR patterns, like those discussed in “Common Vendor Nonconformities & Fixes”, show exactly the kind of defects that move costs from internal to external failure when inspection is weak.
Your ROI calculator is simply a way to quantify this trade-off.
At minimum, your ROI model needs two sides:
Inspection costs are usually the easiest to quantify. They may include:
In your Excel ROI template, these usually sit in a sheet such as Inspection_Costs, with separate lines for each category and each project or year.
Failure costs are messier but more important. They come from:
Internal failures at vendor
External failures at site or after delivery
Where do these numbers come from?
Your ROI calculator does not need perfect precision. It needs defensible estimates that show the scale of costs on each side.
You can implement the NTIA-style vendor inspection ROI calculator as a simple Excel workbook with three main sheets:
Here is how you use it.
Step 1 – Define Scope and Time Period
First, decide what you are calculating ROI for:
Define:
Step 2 – Enter Inspection Costs
In the Inspection_Costs sheet, enter:
You can break this down further (by vendor, equipment type, project phase), but even a high-level summary is useful.
Step 3 – Enter Historical Failure Data
In the Failure_Costs sheet, add rows such as:
Where you do not know exact numbers, use conservative estimates and document your assumptions.
Step 4 – Estimate Prevented Failures
This is the “what if” part of the ROI model.
You can approach it in two ways:
If NCR rate and failure costs decreased, you can attribute part of the improvement to better vendor inspection.
Scenario B: current or proposed inspection plan with defined hold and witness points.
Estimate how many failures Scenario B avoids compared to Scenario A.
Be conservative: assume that not all defects would have become catastrophic failures, but that some percentage would have caused serious cost if left undetected.
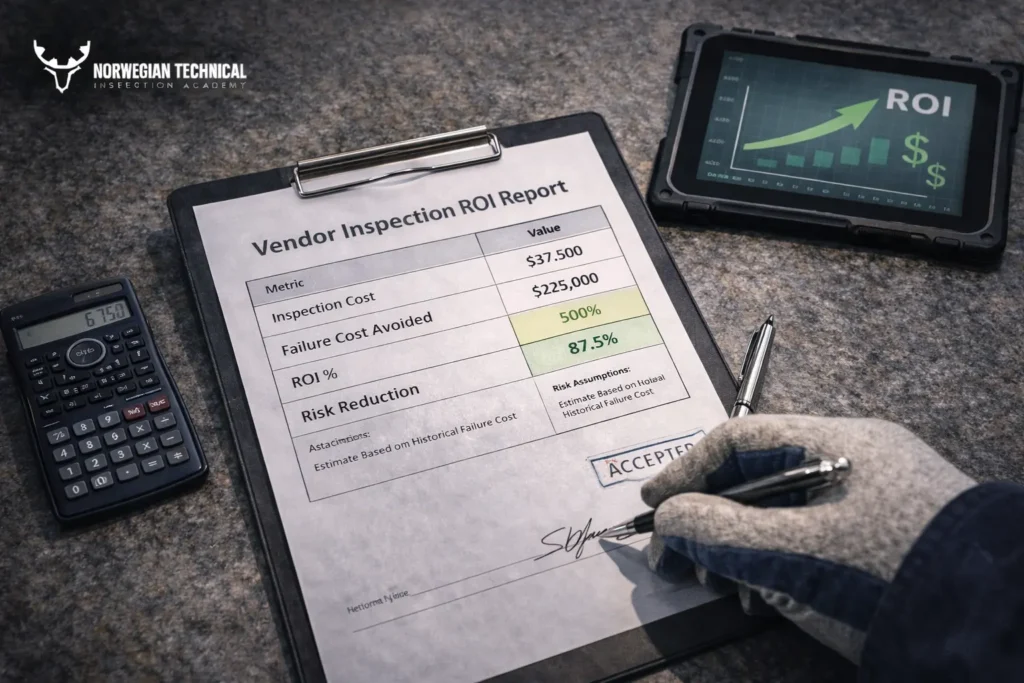
Step 5 – Get the ROI Output
In the ROI_Summary sheet, calculate:
Express ROI as a percentage or a ratio (for example “3.5 : 1”).
Your goal is not to claim unrealistic precision, but to show that even with conservative assumptions, inspection provides a positive and significant return.
Imagine a simple example for a project with a large number of critical valves.
Scenario A – Minimal Vendor Inspection
Over the project, you may see:
The combined cost of site rework, extra man-hours and schedule impact can easily reach six figures on a medium project.
Scenario B – Structured Vendor Inspection
Now consider a case where:
Costs change:
Even with modest assumptions, it is common to find that:
This kind of scenario is much easier to design if your inspection plan is built around a structured ITP as discussed in “Vendor Inspection ITP Template”.
The density and placement of witness and hold points has a direct impact on ROI:
Too many hold points:
Too few hold points:
The right question is not “How many hold points do we have?”, but:
“Which few, well-chosen hold points catch the most serious risks?”
If you design hold and witness points in a risk-based way – as described in “Witness & Hold Points: Examples by Equipment (Pumps/Valves/Vessels)” – you maximise the avoided failure cost per unit of inspection cost, which is exactly what ROI is about.
Your vendor inspection ROI calculator becomes much stronger when it is fed with real performance data.
Vendor scorecards typically track:
These KPIs:
The article “SQS KPIs That Matter (Vendor Scorecards)” discusses which KPIs matter and how to structure them; those same KPIs can be used as inputs and sanity checks in your ROI model.
When teams try to argue ROI informally, they often fall into a few traps.
If you only count:
…and ignore site rework, delay penalties, claims and reputation impact, inspection always looks expensive.
Make sure your model includes both internal and external failure costs.
Project delay is not just:
It often means:
In your ROI calculator, even approximate values for delay and claims can dominate inspection cost.
The opposite mistake is to assume:
That is rarely true. Good practice:
Saying “we think inspection avoids lots of failures” is not enough.
Use:
Most managers will accept that the model is approximate – as long as it is transparent and based on real data where available.
Q1. How do you calculate ROI for vendor inspection?
Define a scope and time period, estimate total inspection cost (internal and external inspection, travel, tests, training) and estimate the failure costs with and without adequate inspection (rework, scrap, delays, claims). ROI is then calculated as: (Failure Costs Avoided – Inspection Costs) ÷ Inspection Costs.
Q2. What data do you need to estimate failure costs?
Typical inputs include the number and type of NCRs, cost of rework and scrap, site rework events and their cost, delay penalties, warranty and claim amounts related to vendor quality issues. You can gather this from IR/NCR logs, project control reports, commercial records and vendor scorecards.
Q3. How accurate does the ROI model need to be?
It does not need to be exact to the last euro. It must be transparent, conservative and credible. The aim is to show that, even with cautious assumptions, inspection produces a clearly positive return, not to predict accounting figures.
Q4. Can ROI be used to adjust the intensity of inspection?
Yes. By comparing scenarios with different inspection levels (for example, more or fewer hold points, more or fewer vendor visits), you can see how inspection cost and failure risk move. That allows you to design inspection levels that deliver good ROI rather than blindly increasing or cutting inspection.
Q5. How does training appear in a vendor inspection ROI model?
Training is part of prevention and appraisal cost. When inspectors gain skills (for example, through structured vendor inspection training), you would expect better detection of issues earlier, fewer NCRs and lower failure costs. In the ROI model, training shows up as a cost in the short term and as a reduction in failure cost in the medium term.
Once you start thinking in ROI terms, vendor inspection decisions change:
NTIA’s vendor inspection ecosystem – from foundational pieces like “Build an ITP & QCP in Vendor Inspection (6-Step Builder)” to practical templates and calculators like this – is designed to support exactly that shift.
If your daily work involves defending inspection budgets, arguing with procurement or trying to secure training for your team, an ROI calculator is more than a spreadsheet. It is your translation tool: it turns technical quality work into a language that managers and finance understand.
When you can look at your own data and say, “Every 1 € we invested in vendor inspection avoided roughly 3–5 € of failures,” vendor inspection stops being a cost to cut and becomes a strategic investment your organisation cannot afford to ignore.
At NTIA (Norwegian Technical Inspection Academy), we specialize in delivering world-class training programs in vendor inspection, quality surveillance, and technical compliance – specifically tailored for professionals in the oil, gas, and energy industries.
Copyright © 2025 by NTIA. All Rights Reserved.